Testing the vision before building it
6 min read
- A six-month innovation experiment at scoutbee tested the CEO’s vision of a procurement dashboard with 28 category managers, before any code was written.
- The research refuted most of the starting assumptions, cost about €30K in external support, and ended with a tested prototype.
Context
scoutbee is an AI-based B2B SaaS platform for supplier discovery and strategic sourcing, based in Würzburg, with Fortune 500 customers such as Siemens, Audi and Airbus. In 2020 I led its innovation team, TheXHive, reporting to CEO Gregor Stühler. Over six months, September 2020 to March 2021, a team of five ran one experiment: Nina Schacht (research coaching), Cora Spoladore and Susi Wunderlich (senior product design), Markus Schrumpf (UX writing), Thomas Manig (illustration). External support cost about €30K.
Starting point
The CEO had a vision: a "Category Mission Control" for procurement teams, connected to an ERP system such as SAP. It was an idea, not a brief. Sales had already sold products that did not exist yet, and validation had rarely happened before a build. User research was new to the company.
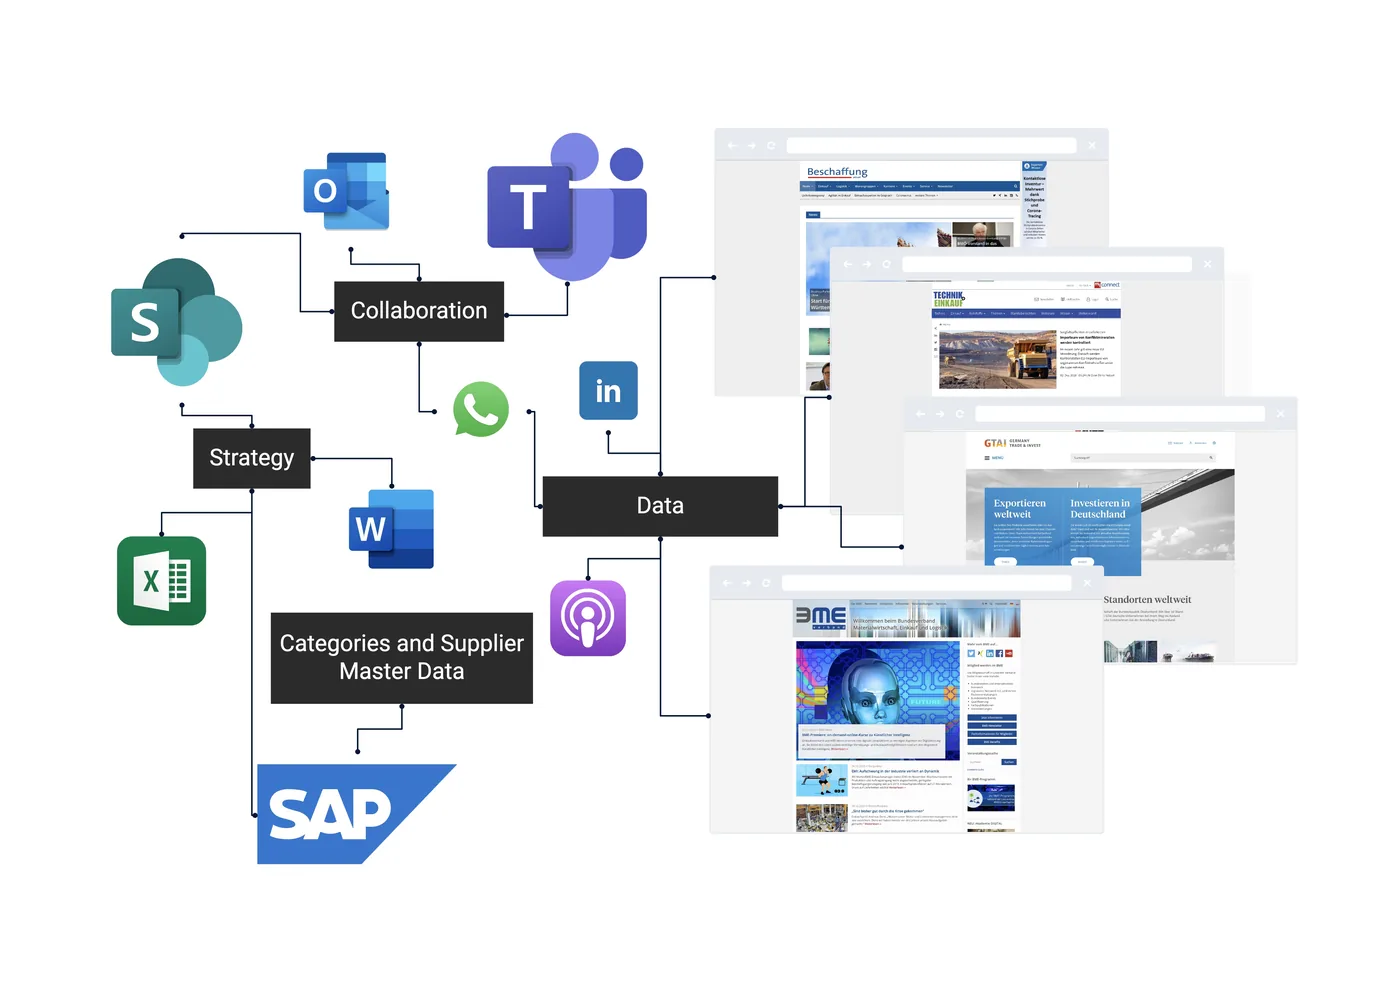
“All data that has to be maintained in different systems is an additional burden that no one can actually afford.”
I turned the idea into a challenge, named it SmartDashboards, and set two research objectives: is there general interest in such a dashboard, and which data, topics and features would it need? Two obstacles stood in the way. We had no direct access to category managers, and the sales team saw no reason to change how products were conceived.
Approach
I ran the experiment on Board of Innovation's "Innovation A to Z", a 23-step decision tree from strategy fit to development. Every activity was mapped to one step, and a 21-question roadmap tracked which steps were done.
Strategy fit. Scoping canvas, a defined user group of strategic buyers and category managers, and the challenge written down.
Problem fit. Access came through LinkedIn: we recruited category managers directly, with incentives cleared by the legal department. Six 60-minute empathy interviews with procurement leads in automotive, machinery and measurement technology, fewer than the framework's ten because B2B interviews converge faster. One key insight, a "How might we" question, and three personas. Problem fit was confirmed in January 2021.
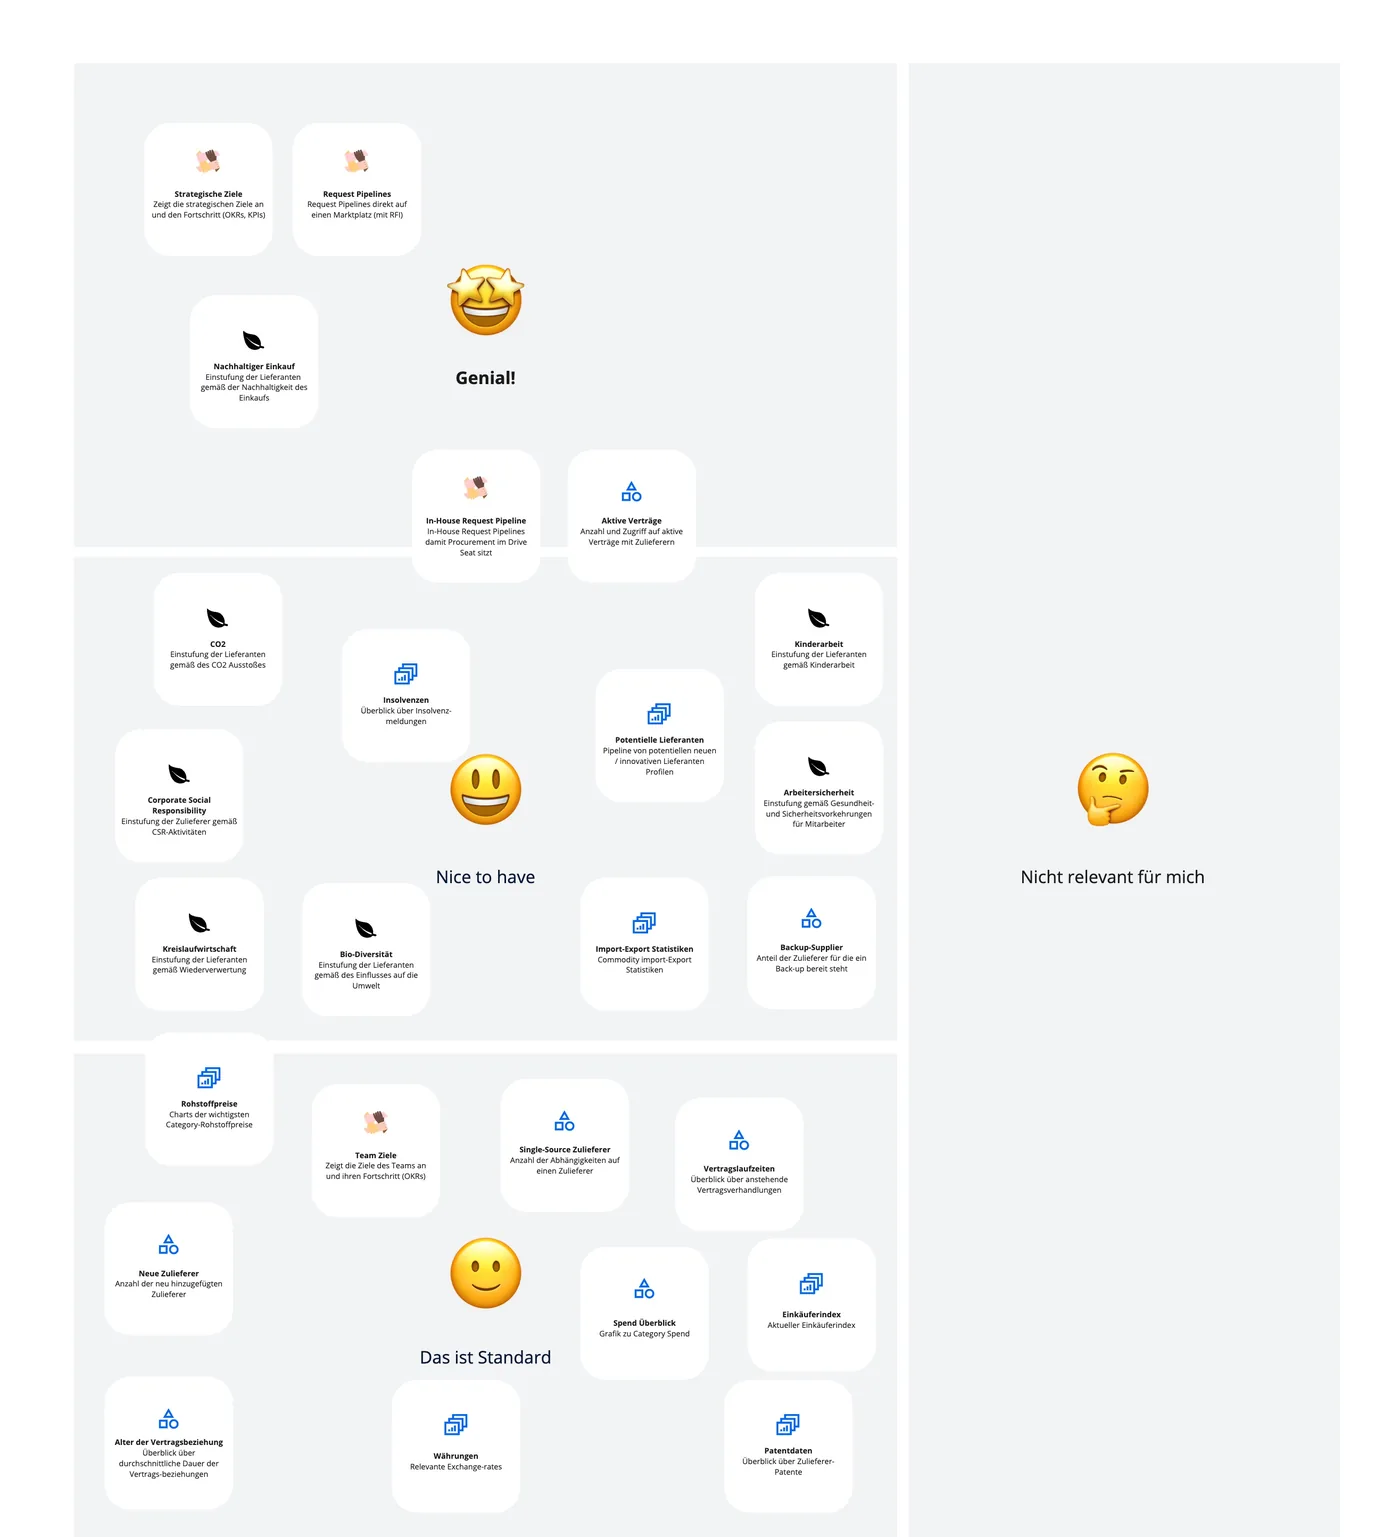
Solution fit. Ideation rounds, an assumption map, and a survey in German and English with 28 responses, mostly from companies above 50,000 employees. Four feature-sorting workshops in which participants ranked 58 data points. A storyboard, then a 13-screen prototype, tested with seven category managers.
Market fit. Business model, ROI and stakeholder buy-in were still open when the documentation ends.
Sales ran alongside on two tracks: I brought the team into the research and explained what we did and why, and I brought in Nina Schacht, who had built the research team at Tier Mobility, to coach both sales and my designers.
Decisions
Pitch before validation. The framework places the executive pitch at step 20, after validation. I pitched to leadership and shareholders at step 7, in December 2020, because the project would not have survived otherwise. I would run that order differently today, see Learnings.
No universal product. Interviews showed that category management differs by company, position and organisational setup. I set personalisation as the core principle: "It can be as complex or as simple as you like."
Alerts first, collaboration later. The CEO's vision and my own pitch put collaboration at the centre. Workshop participants put automatic alerts on supply risks first and collaboration last, and showed no interest in social media data. I followed the evidence and deferred collaboration.
“I don’t need to know about active contracts. What might be of interest is an alert: the contract is ending soon, act on it.”
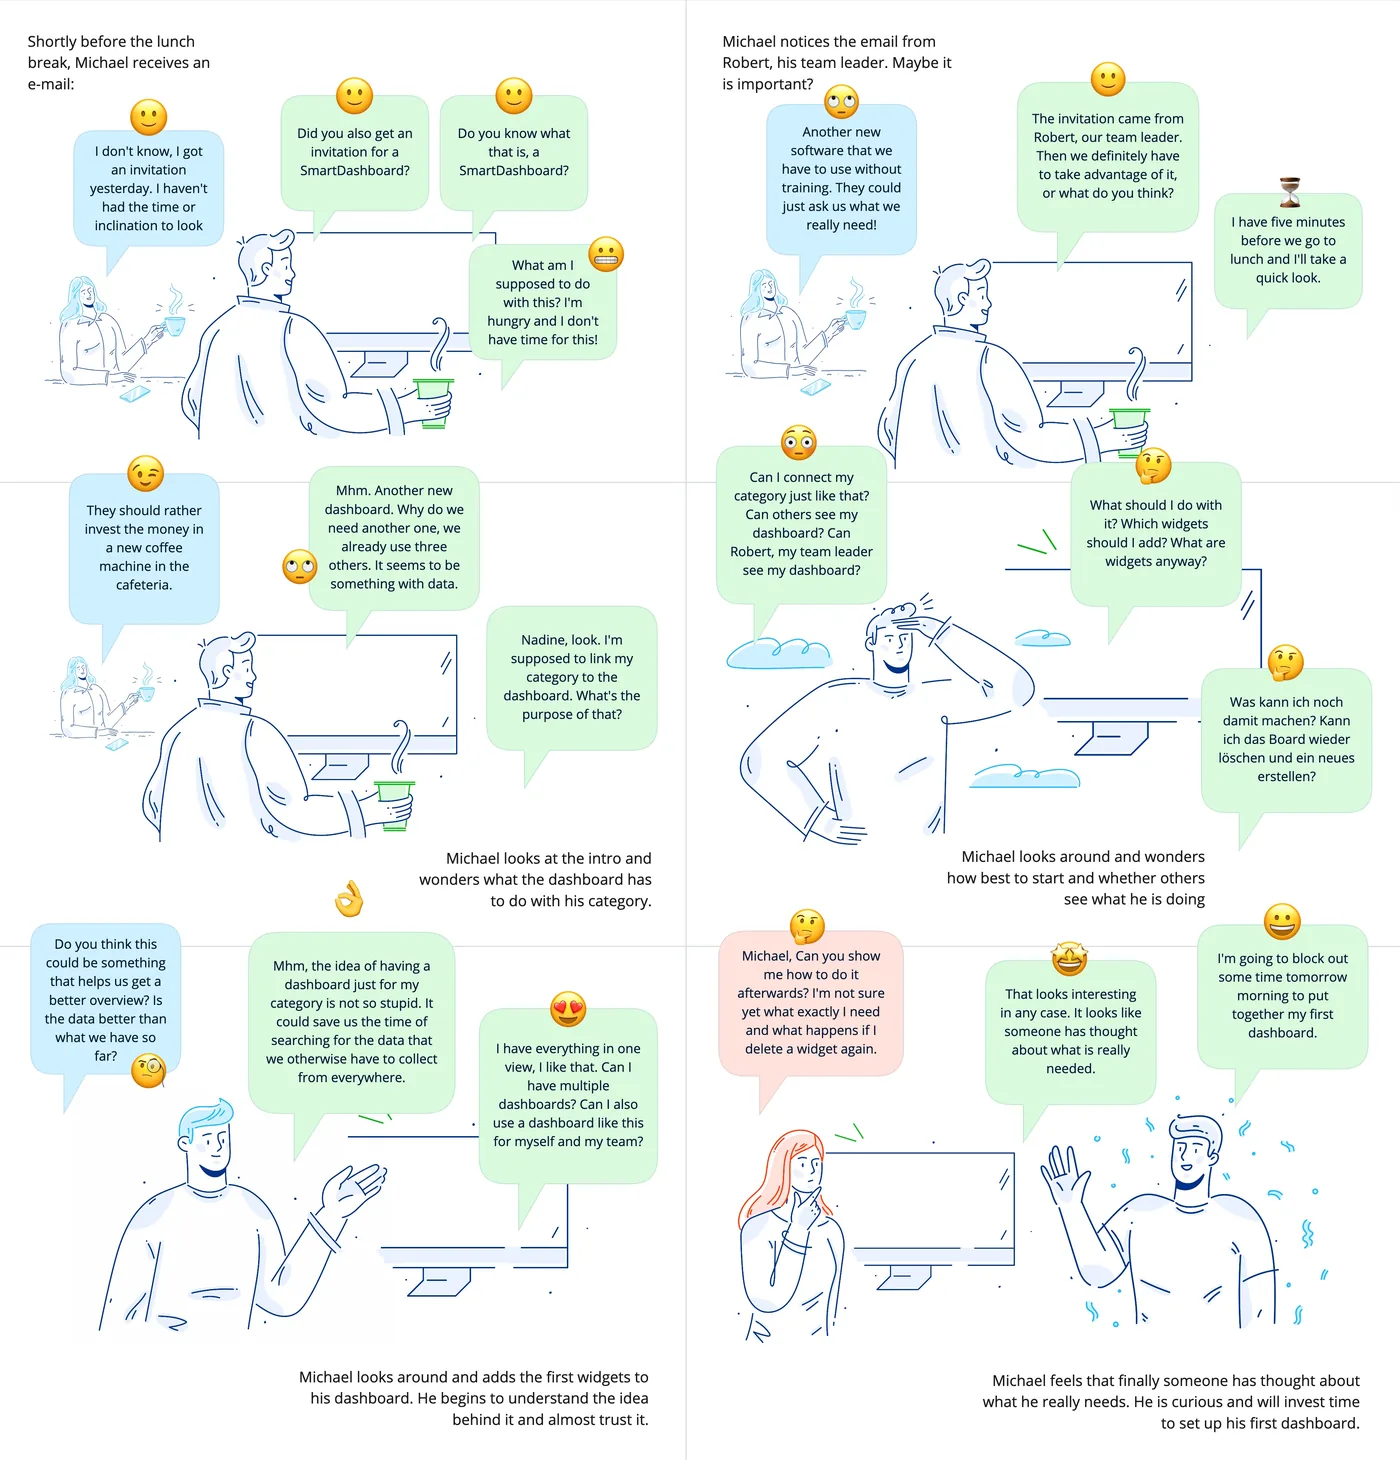
Onboarding by product psychology. I designed the first-run flow around two effects: link one category and watch the system connect it (labour illusion), then see a supplier map immediately (hyperbolic discounting), with further features introduced step by step to keep cognitive load low.
Results
The research refuted most of the starting assumptions. The CEO and the advisory board were surprised by it.
What held: the problem. Nine in ten surveyed category managers kept their data in several systems and said transparency towards management could be higher. Interviewees learned of supplier insolvencies "mostly by chance".
What did not hold: collaboration. A central solution to collaborate on the category strategy drew the lowest agreement of all eleven statements, below every problem statement and every other solution. The collaboration feature that had anchored the pitch moved to a later phase.
What the workshops confirmed. The survey ranked five problems and six solution ideas. Four workshops then sorted 58 feature cards by interest. The idea with the lowest agreement, collaboration, landed in the lower tier. What rose to the top had not been asked at all: automatic alerts.
Problem statements · survey, share who agree
Solution statements · survey, coloured by workshop interest
Workshops
Sources: assumptions survey and feature sorting card workshops.
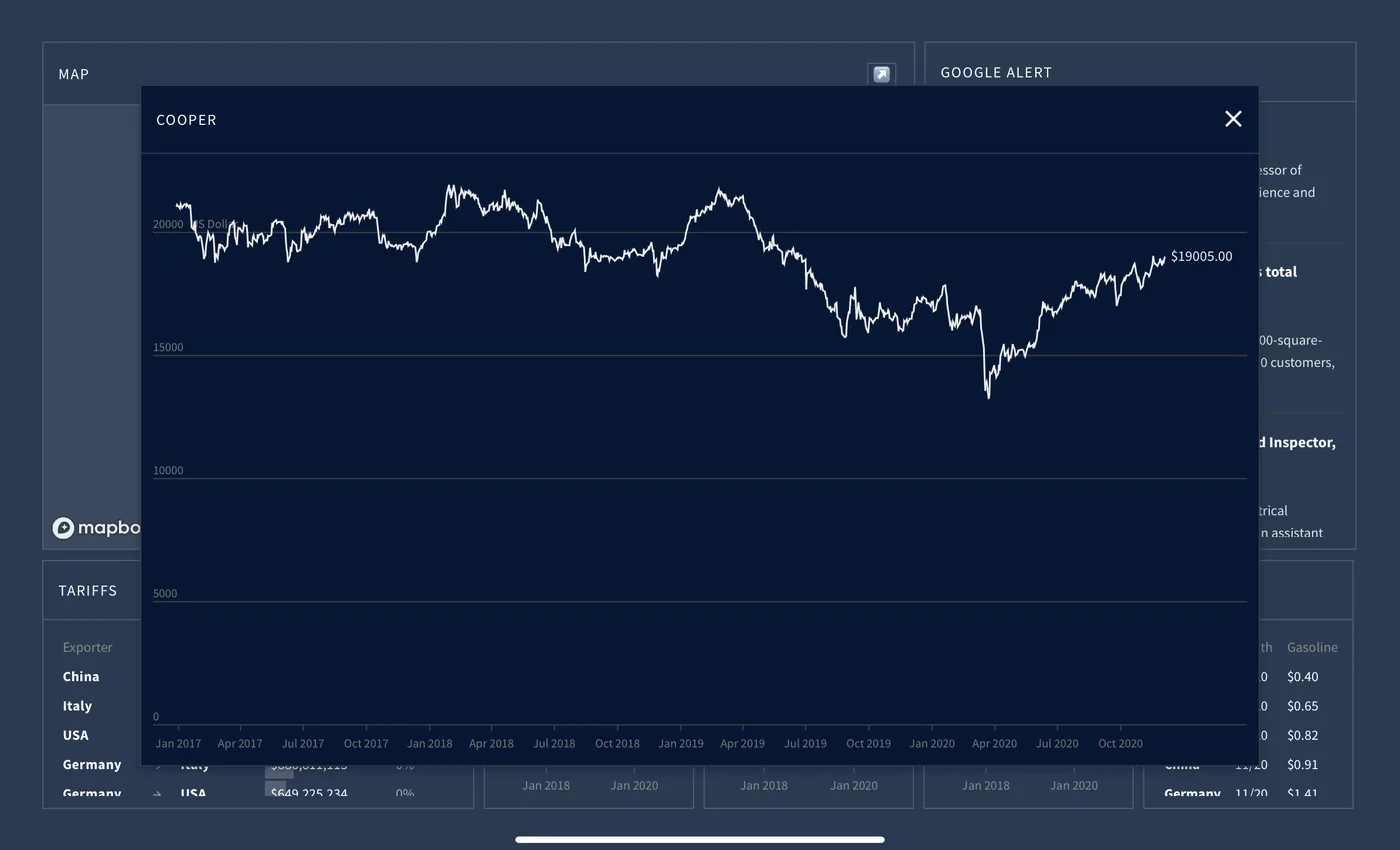
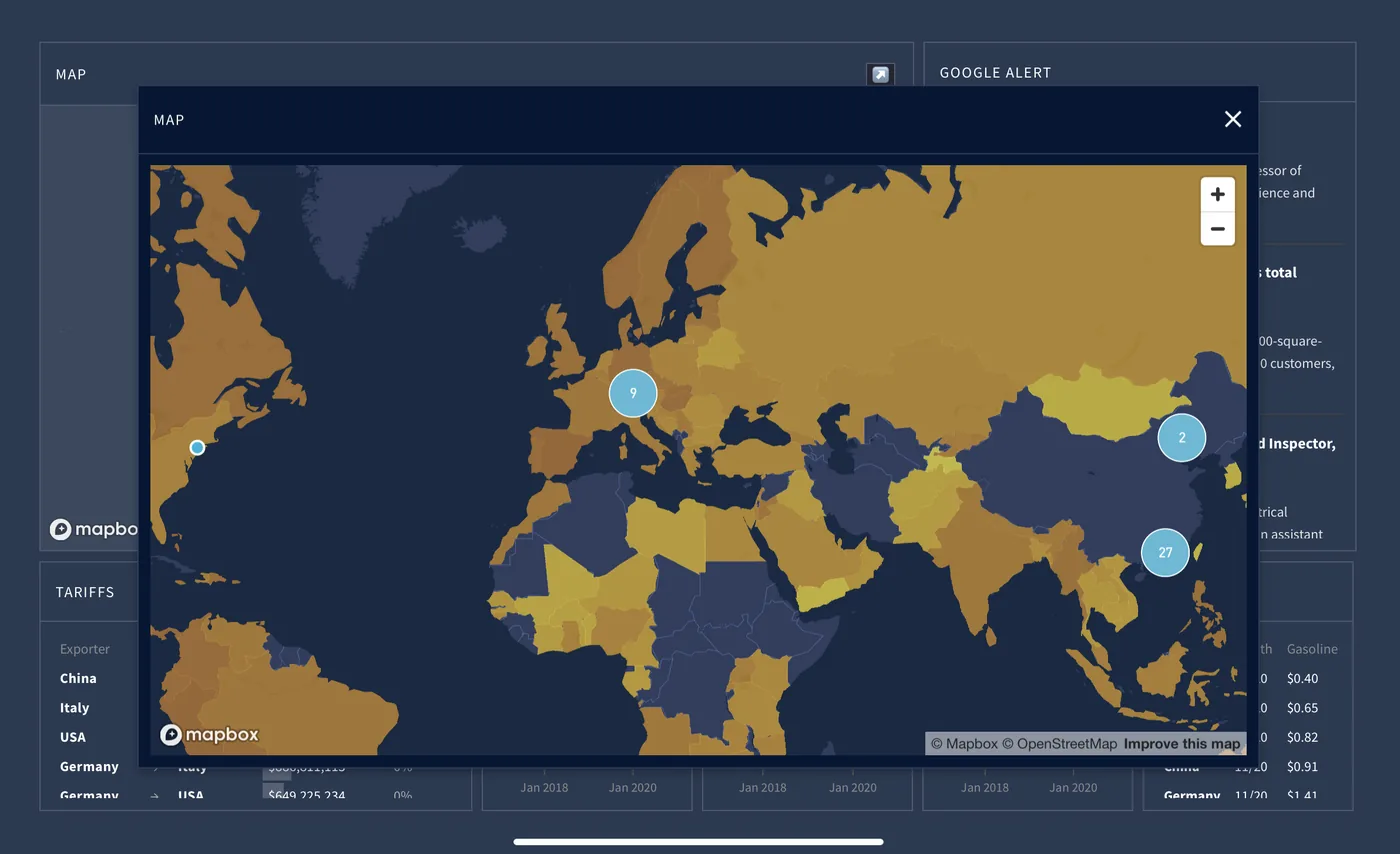
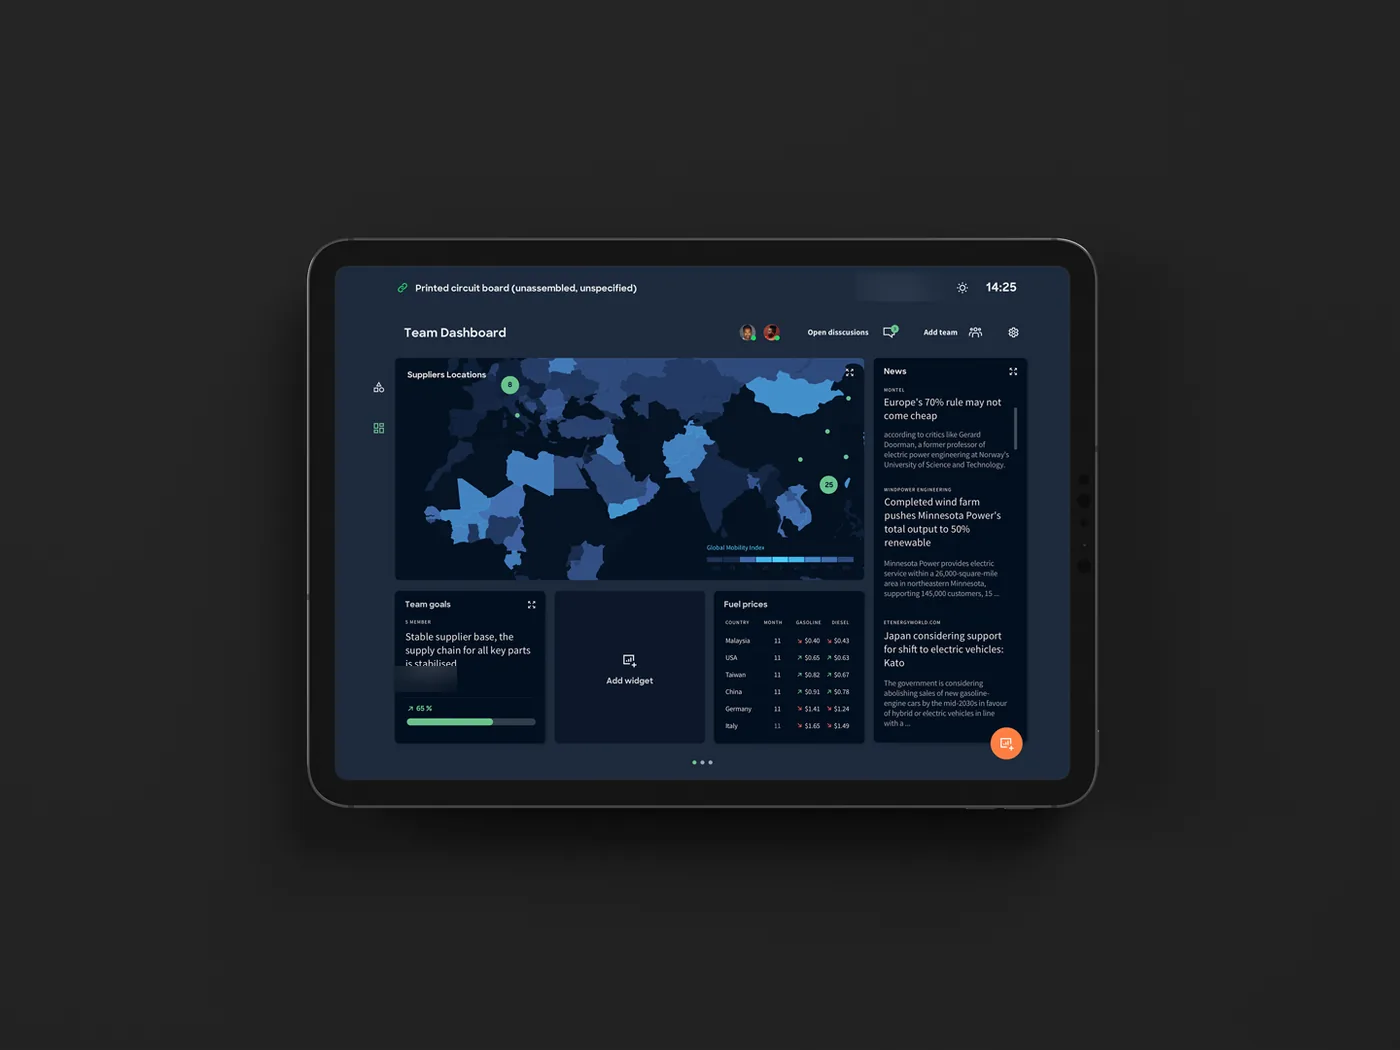
Delivered: interview guides and summaries, personas, survey, workshop analysis, storyboard, a tested 13-screen prototype, and a data concept of eight dashboard topics. The prototype tests went well.
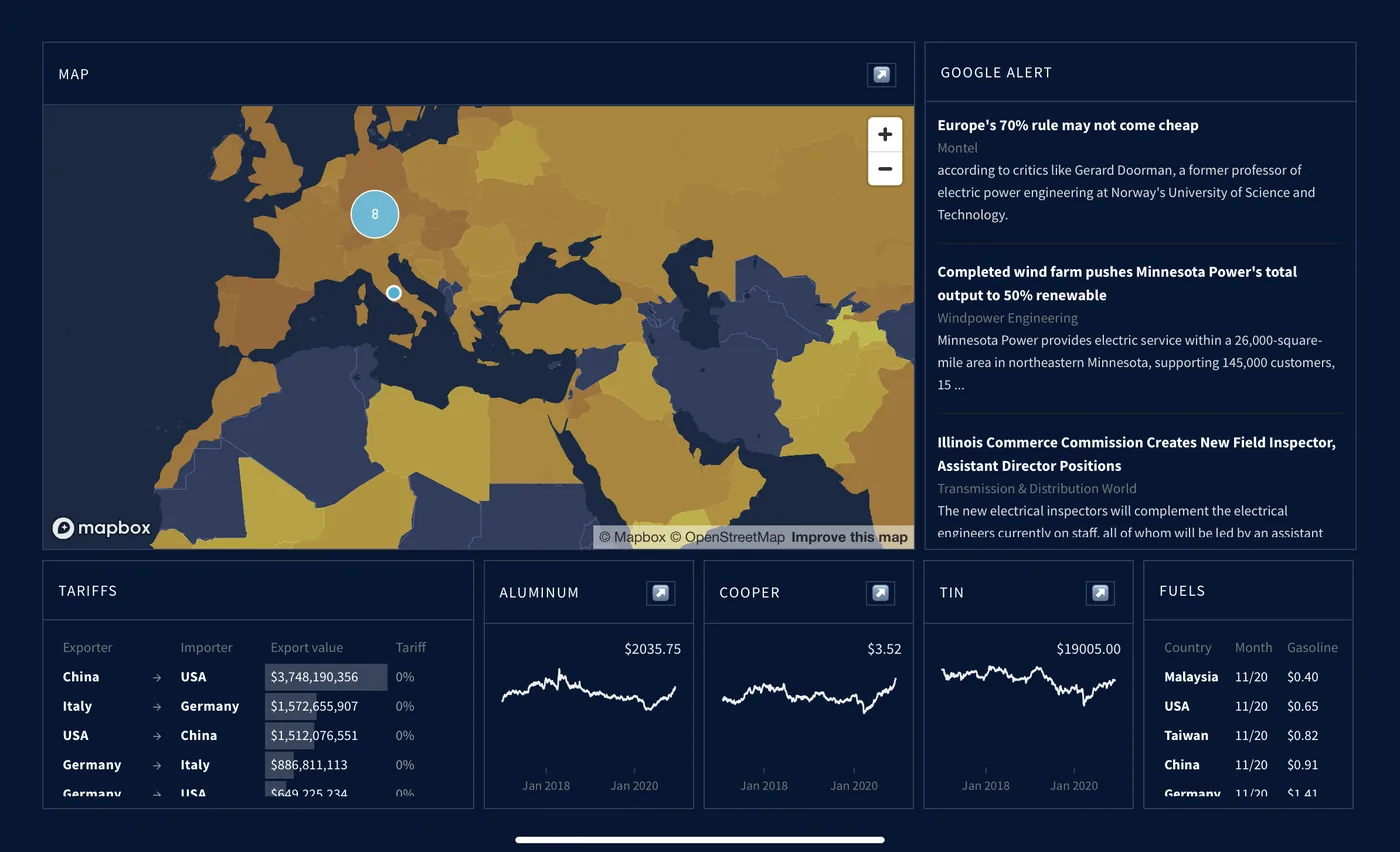
Status in framework terms: problem fit confirmed, solution fit reached with a tested prototype, market fit not started. I left scoutbee in July 2021. The decision on what to build from the results was taken after that.
Learnings
Don't believe everything you think. My mental model of category managers was not theirs, and neither was the CEO's. Listening and watching how people work taught more than any concept slide.
Trust the process, let the evidence decide. Pitching before validating kept the project alive, but it set expectations the research then overturned. Today I would run stakeholder workshops from the start, so that leadership forms its assumptions together with the team and sees them tested.
Evidence saves time, nerves and money. Six months and about €30K in external support were enough to stop a build on unvalidated assumptions. That principle, and the habit of working from a plan, came with me to ClimatePartner.
Dealing with similar challenges in your organisation?
- 2 min
- 3 steps
- Reply in 2 days